

Introduction #
This guide explains how to read the Qilowatt app dashboard and what the different indicators and sections mean.
The dashboard provides a clear and comprehensive overview of all your devices in one place, helping you better understand energy flows, costs, and revenue.
The dashboard provides a clear and comprehensive overview of all your devices in one place, helping you better understand energy flows, costs, and revenue.
How to read the dashboard? #
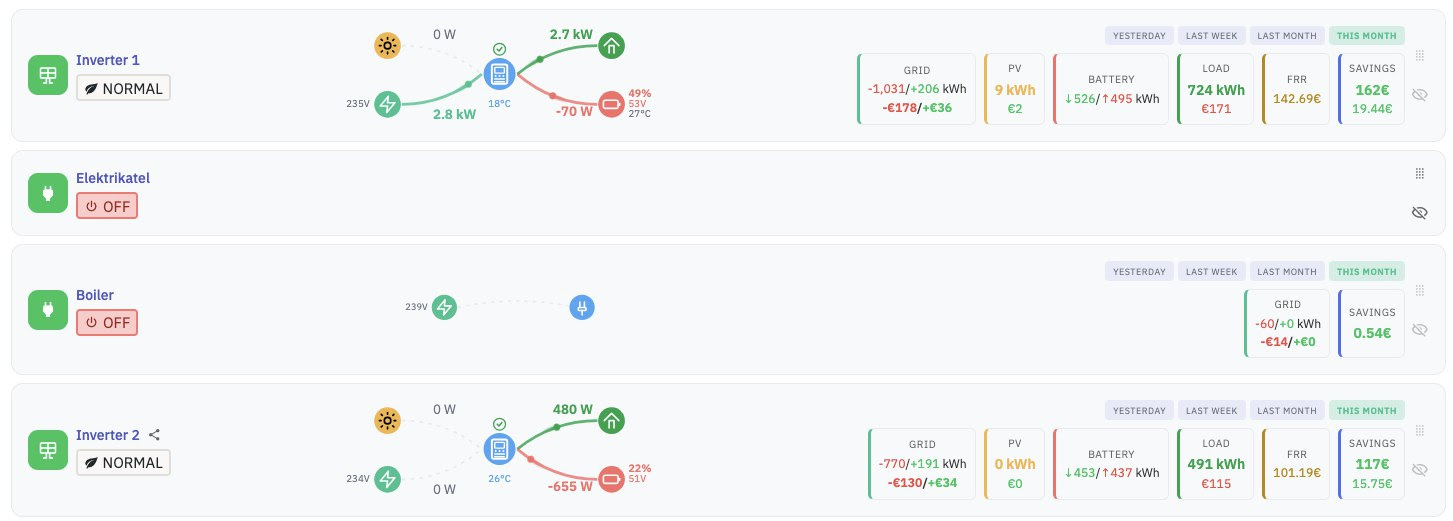
Device status #
- A green icon next to the device name indicates that the device is online.
- Below the device name, the current status is displayed:
- Boilers – ON / OFF status
- Inverters – current work mode
👉 To change the work mode, click on the work mode button.
Animated energy flow
#
In the main view, you will see a real-time animated diagram that visualizes your energy flows.
This provides a detailed overview of:
• where energy is coming from,
• where it is going,
• how your system is currently operating.
This provides a detailed overview of:
• where energy is coming from,
• where it is going,
• how your system is currently operating.
Statistics section #
Each device features a statistics section that displays both energy volumes (kWh) and financial cost/revenue.
• Grid – The amount of energy purchased from and sold to the grid, along with its associated cost and revenue. For inverters, these quantities are also visible on your electricity seller’s bill, though they may differ slightly within the margin of measurement error. For other devices (boiler, heat pump, etc.), the energy volumes of that specific device are measured. Financial cost and revenue include all components entered into your device’s energy profile, such as margins, grid fees, taxes, etc. The cost figure (red) represents the cost of purchased energy; the revenue figure (green) represents the value of energy sold to the grid.
• PV – The amount of energy produced by solar panels and its financial value if it had been purchased from the grid. Produced energy shows only the amount of energy generated by the solar panels. The financial value is estimated and calculated based on the electricity import price configured in the energy profile, multiplied by the amount of energy produced.
• Battery – Battery charging and discharging volumes, i.e., the amount of energy stored in and used from the battery during the period.
• Load – Energy consumed by the load and its cost in the case of direct consumption from the grid. This reflects the total energy consumption measured by the inverter at home (or another location) and its estimated cost if it had been consumed directly from the grid, calculated by multiplying the consumption by the energy import price configured in the energy profile.
• FRR – Revenue earned from participating in the regulation market. Includes both regulation market and capacity market revenue.
• Savings – Your financial savings both with and without regulation market revenue. If there is no regulation market revenue, both figures will be the same.
For inverters, this is calculated using the formula: (cost of energy consumed at home – cost of energy purchased from the grid + revenue from energy sold to the grid), plus FRR revenue.
For other devices (such as a boiler), it is calculated by taking into account the daily consumption times of the controlled device’s historical baseline consumption and comparing it with the prices during the actual times of the managed consumption.
• PV – The amount of energy produced by solar panels and its financial value if it had been purchased from the grid. Produced energy shows only the amount of energy generated by the solar panels. The financial value is estimated and calculated based on the electricity import price configured in the energy profile, multiplied by the amount of energy produced.
• Battery – Battery charging and discharging volumes, i.e., the amount of energy stored in and used from the battery during the period.
• Load – Energy consumed by the load and its cost in the case of direct consumption from the grid. This reflects the total energy consumption measured by the inverter at home (or another location) and its estimated cost if it had been consumed directly from the grid, calculated by multiplying the consumption by the energy import price configured in the energy profile.
• FRR – Revenue earned from participating in the regulation market. Includes both regulation market and capacity market revenue.
• Savings – Your financial savings both with and without regulation market revenue. If there is no regulation market revenue, both figures will be the same.
For inverters, this is calculated using the formula: (cost of energy consumed at home – cost of energy purchased from the grid + revenue from energy sold to the grid), plus FRR revenue.
For other devices (such as a boiler), it is calculated by taking into account the daily consumption times of the controlled device’s historical baseline consumption and comparing it with the prices during the actual times of the managed consumption.
Time intervals #
You can select a preferred time period to view statistics for:
• Current month
• Previous month
• Last week
• Yesterday
This allows you to compare performance across different periods.
• Current month
• Previous month
• Last week
• Yesterday
This allows you to compare performance across different periods.
Device management #
Using the icon in the top right corner, you can:
• Sort devices
• Hide devices that you do not currently want to monitor
Hidden devices appear at the bottom of the view under “Hidden devices”.
• Sort devices
• Hide devices that you do not currently want to monitor
Hidden devices appear at the bottom of the view under “Hidden devices”.


